Gantt Chart
Upon completion of the routing and optimization, LesCaS presents user with further simulation statistics through Gantt Chart.
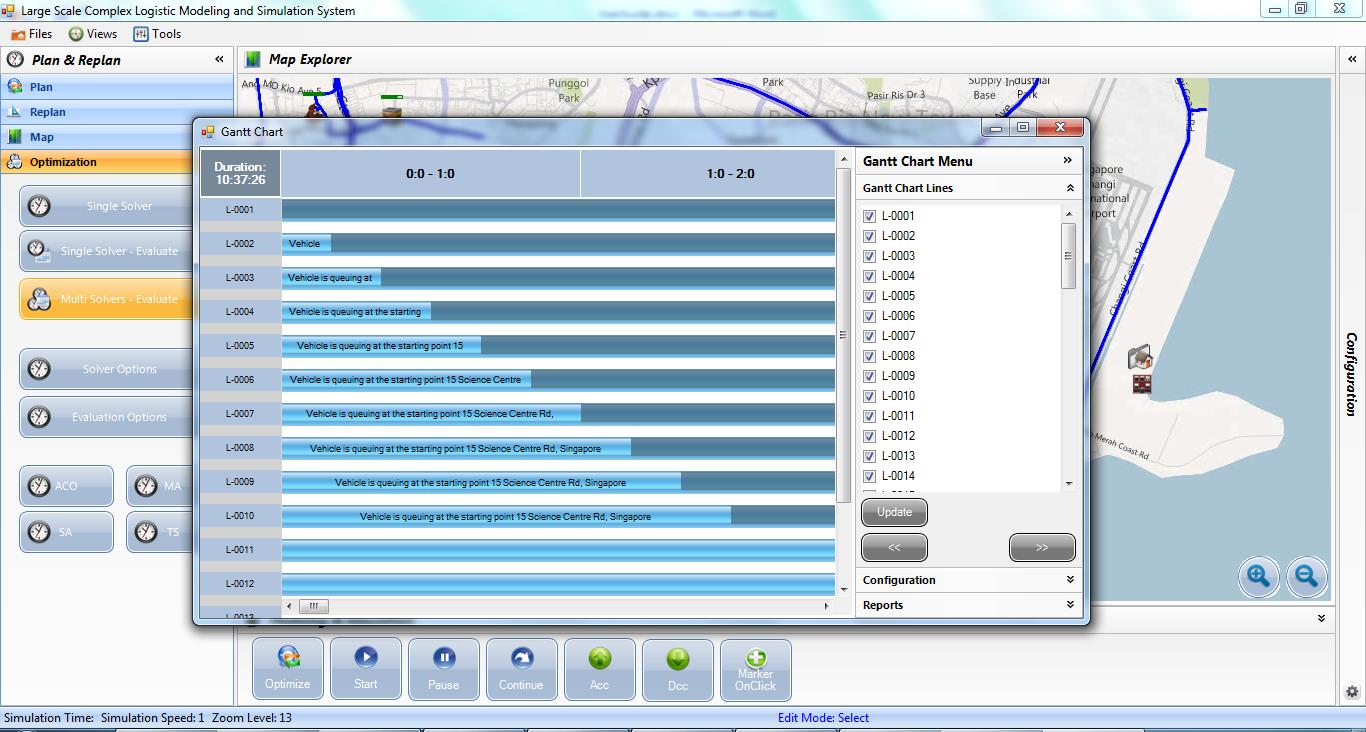
The Gantt Chart shows the start/end time of each task carried out by each vehicle from the start of the operation until the end of the entire operation. User can perform the following analysis through Gantt Chart:
- Analyze individual vehicle activity and events by selecting which vehicle to display in the Gantt Chart
- Move the display period forward and backward

- Zoom in/out on the Gantt Chart
- Select the periods of operations to be displayed on the Gantt Chart

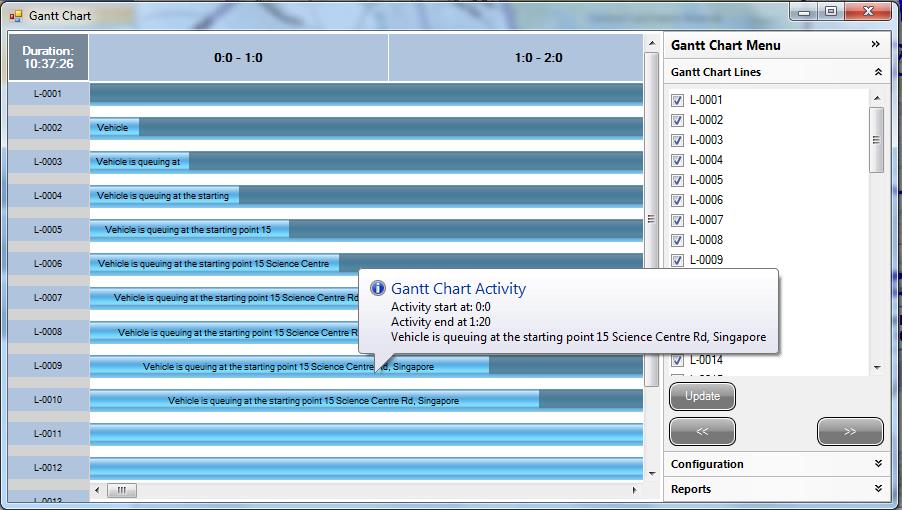
- Display vehicle activity details

- Show activity detail on mouse move over
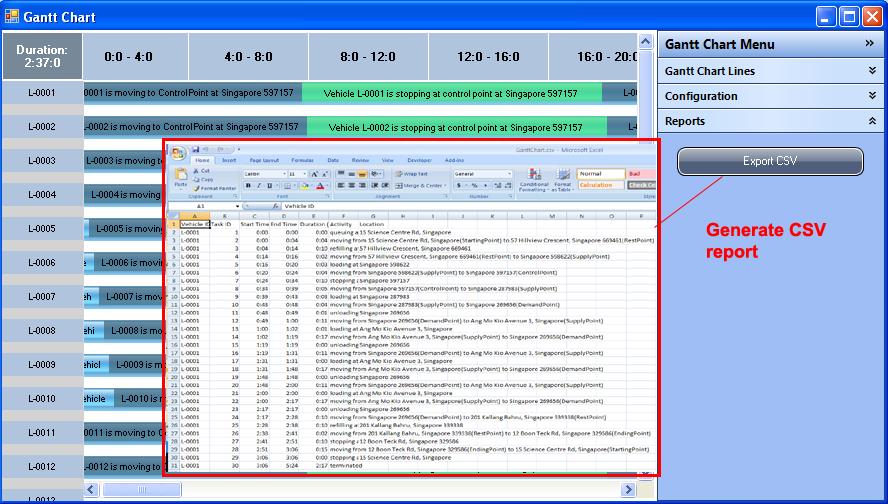
- Generate Gantt Chart report in CSV file